The Liquidity Indicator on TradingView is an important tool for market activity analysis and helps traders understand how easily they can buy or sell a crypto asset / futures contract at the current market price. This metric is especially useful in high volatility conditions, where levels can change abruptly, affecting traders’ strategies and decisions.
Applying the liquidity indicator on the TradingView platform allows investors to assess risks and opportunities in real time. In this article, we will examine in detail how to use this indicator to improve trading strategies and optimize investment portfolios, as well as which exact liquidity indicators on TradingView can be used in trading.
- What are liquidity indicators in simple words
- Why and how to use in trading
- Best liquidity indicators on TradingView: which indicator shows liquidity
- Liquidity Swims (by LuxAlgo)
- Buy/Sell Side Liquidity Zone
- Liquidity Weighted Moving Averages (LWMA)
- Liquidity Trendline with Signals
- Liquidity Heatmap
- Fair Value Gaps (FVG)
- Common mistakes when using
- FAQ: Questions and Answers
What are liquidity indicators in simple words
Liquidity indicators on the TradingView platform help traders evaluate how actively a particular asset is traded and how easily it can be bought or sold at a stable price at any given moment. Simply put, these indicators show how many buyers and sellers are participating in trading and how this influences price movement. Understanding the distribution of capital among market participants is possible through special liquidity tracking tools. These tools identify key areas on the chart where:
- Market makers accumulate volumes to initiate price movements.
- Unfilled limit orders of traders remain.
- Stop orders of most participants are concentrated.
Forecasting market dynamics becomes more accurate when you identify liquidity zones. This allows you to:
- Distinguish genuine trends from manipulative movements.
- Identify potential false breakout points.
- Predict price movement directions aimed at gathering liquidity.
Using liquidity indicators on TradingView enables traders to make informed decisions, adapt to constantly changing market conditions, and manage risks more effectively.
Why and how to use in trading
Liquidity indicators on TradingView are valuable tools for market analysis and decision-making in trading. They help traders assess how quickly and without significant price changes they can execute a trade. For example, high liquidity usually indicates the ability to conduct large trades without significantly impacting the asset’s price. You can use these indicators in several ways:
- Identifying entry and exit points. With high liquidity, traders can confidently enter or exit positions, knowing that the trade will not cause a sharp price change.
- Risk management. By analyzing liquidity levels, traders can avoid trading during low-volume periods, reducing slippage risk and unexpected market failures.
- Market trend analysis. Changes in liquidity can also signal the beginning of new market trends or volatility shifts, allowing traders to make more informed decisions comprehensively.
Effective use of liquidity indicators can increase trading accuracy and efficiency, minimize risks, and improve overall trading results.
Best liquidity indicators on TradingView: which indicator shows liquidity
Below is a list of liquidity indicators on TradingView that are available for free — they can also be downloaded for MT4, customized, or used on exchanges like Bybit.
Liquidity Swims (by LuxAlgo)
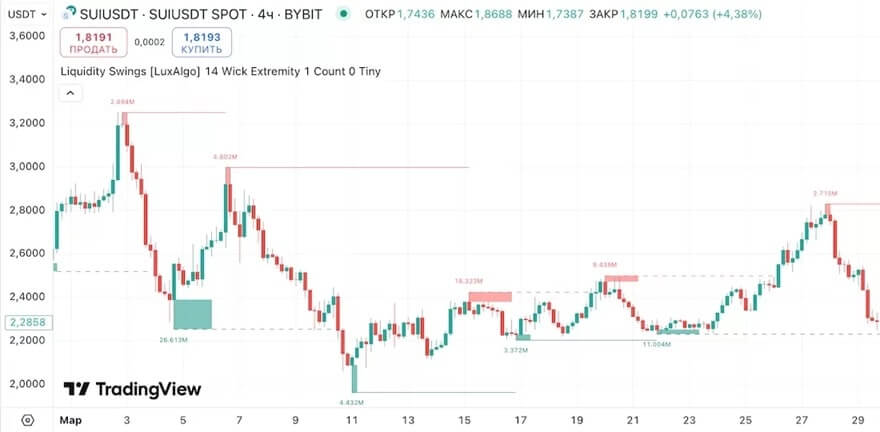
Leading our list is Liquidity Swims by LuxAlgo (liquidity removal indicator). This tool detects concentration zones of stop orders. It marks areas where many stop-loss orders are likely placed — above or below key levels. This allows traders to identify vulnerable positions of most market participants and shows potential price movement directions for “collecting” available liquidity. How to use:
- Identify zones of extremum concentrations where candle highs or lows cluster — these zones often mark the end points of price movement before trend reversal.
- When the price moves through these zones, there are two promising entry options: wait for a retracement to the breached level, or open a position against the main movement in case of a false breakout.
- This method works well in conjunction with: analysis of actions by large market players (market makers), order block strategies, and fake breakout tactics.
Ideal for traders using Price Action strategies, analyzing market maker activity, and employing imbalance and order block concepts.
Buy/Sell Side Liquidity Zone
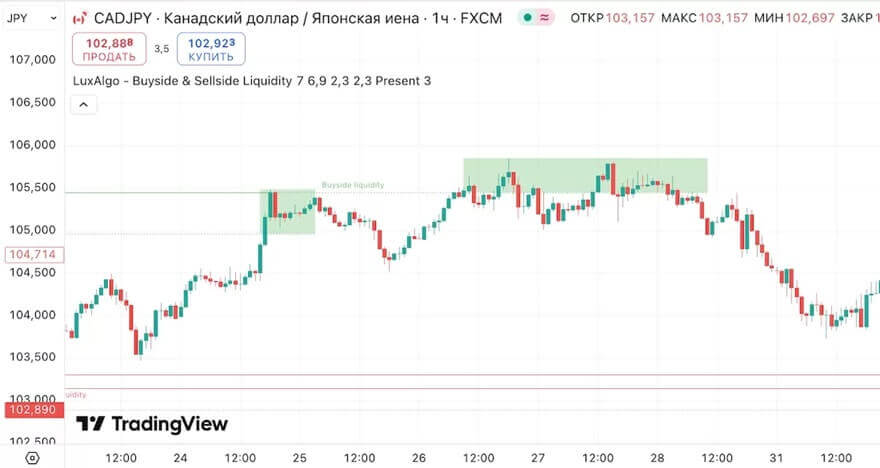
An indicator showing liquidity growth on both sides of the market. It displays sell zones below lows and buy zones above highs. Understanding the placement of traders’ stop orders provides insight into potential price movement directions, as the market often gravitates toward these levels.
Usage instructions: when buy or sell zones appear, wait for a market reaction and then open a position opposite to the breakout. This strategy is particularly effective during manipulative moves preceding a trend change.
Target audience: traders focusing on fake breakouts, reversal patterns, and stop-loss liquidation strategies.
Liquidity Weighted Moving Averages (LWMA)
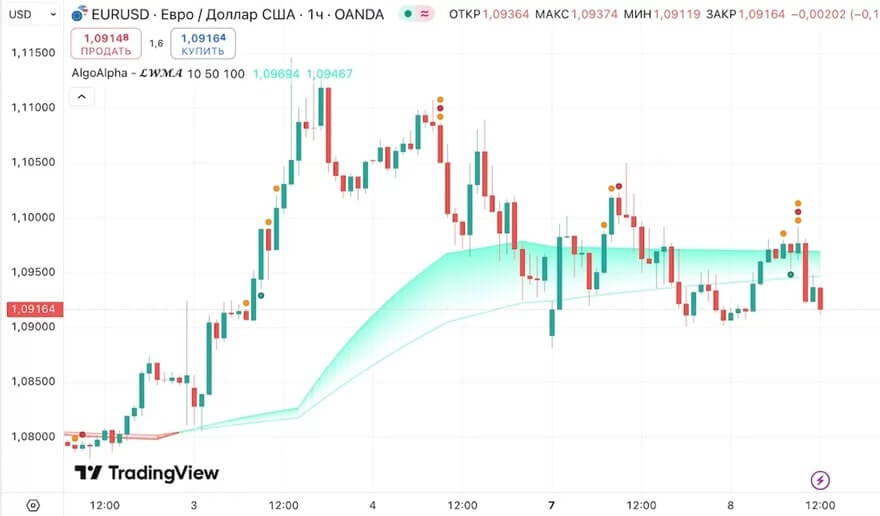
Dynamic support or resistance levels can be identified with LWMA. Unlike standard smoothing methods, this tool considers liquidity factors when averaging prices. This allows traders to recognize areas where price movement is backed by real capital, distinguishing them from artificially generated impulses.
Application: filter trend movements and identify entry points by combining LWMA with other directional indicators. It’s ideal for traders aiming to enhance the accuracy of moving average signals.
Liquidity Trendline with Signals
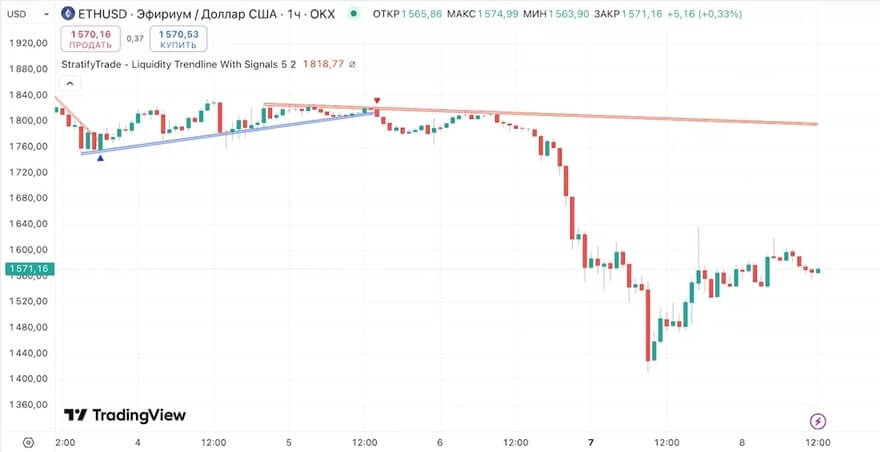
This indicator creates diagonal zones characterized by high trading activity and generates alerts when crossing these zones. Particularly effective for breakouts, wedges, and triangle patterns, especially when combined with volume analysis and key levels.
Use: open positions during retests of dynamic trend lines with high liquidity. Ideal for Price Action traders, trend-based analysis, and those working with compression and consolidation patterns.
Liquidity Heatmap
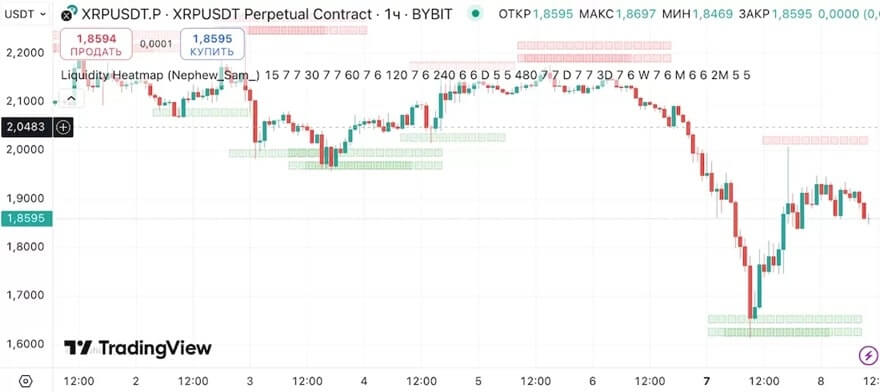
Unlike standard indicators like MACD or RSI available on TradingView, the liquidity heatmap is a specialized analytical tool. It requires platforms like ExoCharts or TradingLite.
These services generate visual representations of order concentration similar to thermal imaging: high-density zones are highlighted with more intense lighting. Essentially, they convert order book and transaction flow data into an easy-to-understand heatmap.
This visualization allows traders to instantly identify levels where market participants place their orders in anticipation of certain prices.
Application: identify order concentration zones to spot potential reversals or target levels. Effective in various trading strategies — from scalping to futures trading. Especially useful for futures traders actively using the tape and order book data.
Fair Value Gaps (FVG)
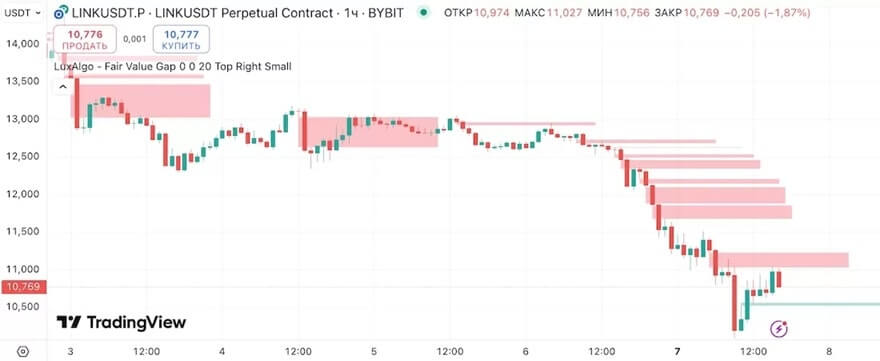
The liquidity zone indicator highlights previous price movement areas that need filling. It marks zones where rapid price changes occurred with low trading volumes. These areas, often gaps, tend to attract price reversion. This mechanism helps identify potential reversal points and market inefficiencies. The algorithm:
- Monitor for re-entry into marked zones.
- Analyze signs of trend change (look for candle pattern confirmations): bullish formations for upward reversals; bearish patterns for downward moves.
- Pay special attention: if the marked area coincides with a liquidity zone, it signals a strong entry point.
Ideal for traders tracking market maker activity, analyzing imbalance zones, and employing retracement strategies.
Common mistakes when using
Blindly following the liquidity indicator without considering the overall market context and proper trading education is a common mistake among traders. While useful for identifying moments of increased buying or selling activity, its effectiveness diminishes without analyzing additional factors like news, macroeconomic data, and major market trends.
Ignoring the importance of choosing the right timeframe (5 minutes or daily) also leads to incorrect conclusions. Liquidity indicators can give different signals on short-term and long-term charts. For example, high liquidity on a 1-minute chart might be just a short-term wave, whereas a daily chart reveals the overall trend and market reality.
Expecting 100% accuracy from the liquidity indicator in zone analysis is another mistake. Though it can sometimes effectively signal reversals or breakouts, traders should remember that no analysis tool can predict market conditions flawlessly. Complementary analysis and other indicators can improve trading results and reduce risks.
FAQ: Questions and Answers
What are the main functions of liquidity indicators on TradingView in the spot market?
Liquidity indicators help traders evaluate how easily they can buy or sell a crypto asset without significantly impacting its future price. They show trading volume and help determine market volatility.
Can I customize liquidity indicators on TradingView?
Yes, users can customize liquidity indicators according to their needs. Customization options include changing time frames, colors, and other parameters to better suit trading strategies.
How can liquidity indicators improve my trading strategies?
Using indicators helps traders better understand market conditions, aiding in making well-informed buy or sell decisions. They are an essential component for minimizing risks and maximizing potential profits.